CGM DATA
Gain actionable insights with CGM data to help optimize treatment decisions. Learn how to access and interpret glucose trends easily to better support your patients living with diabetes.
Click to enlarge.
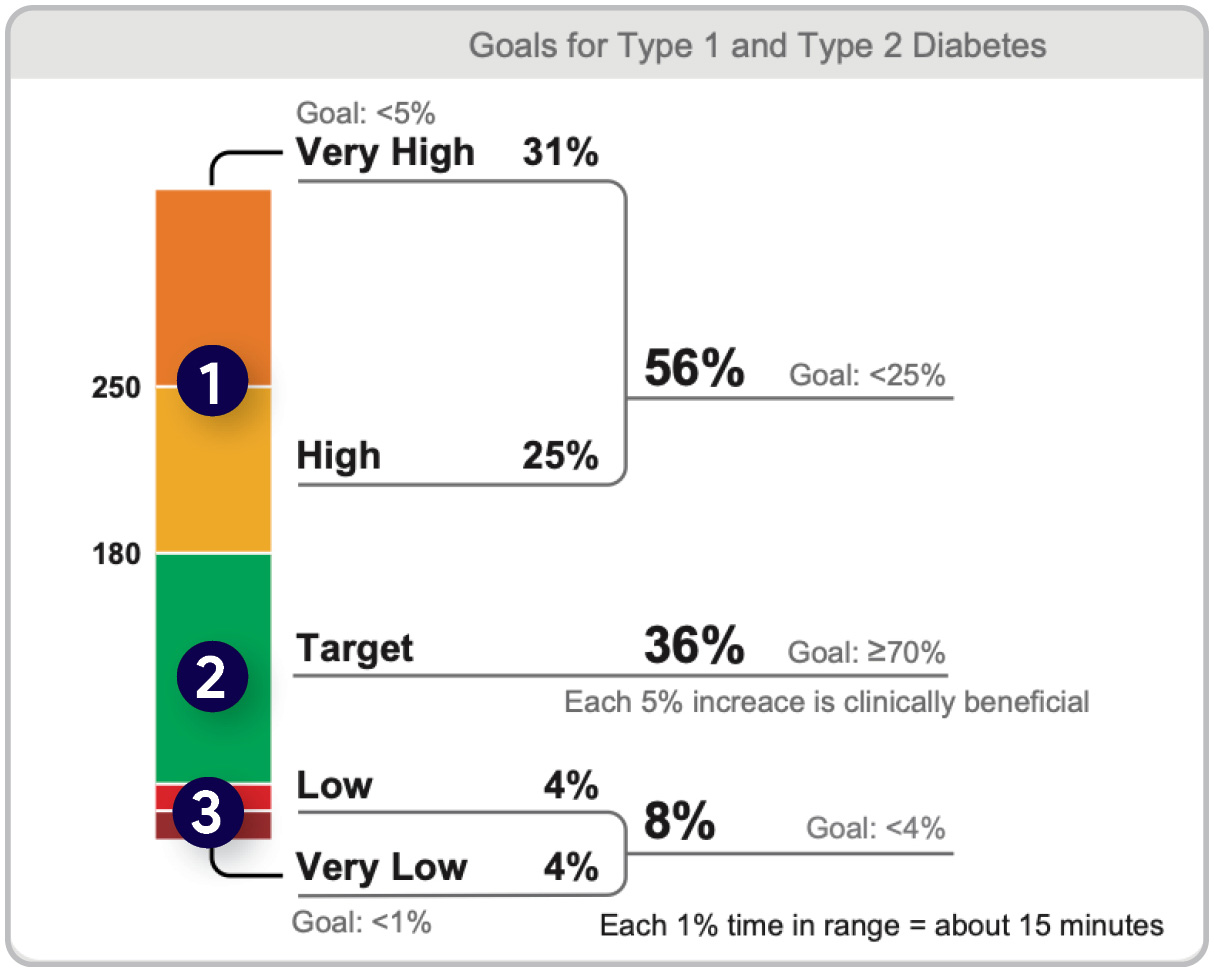
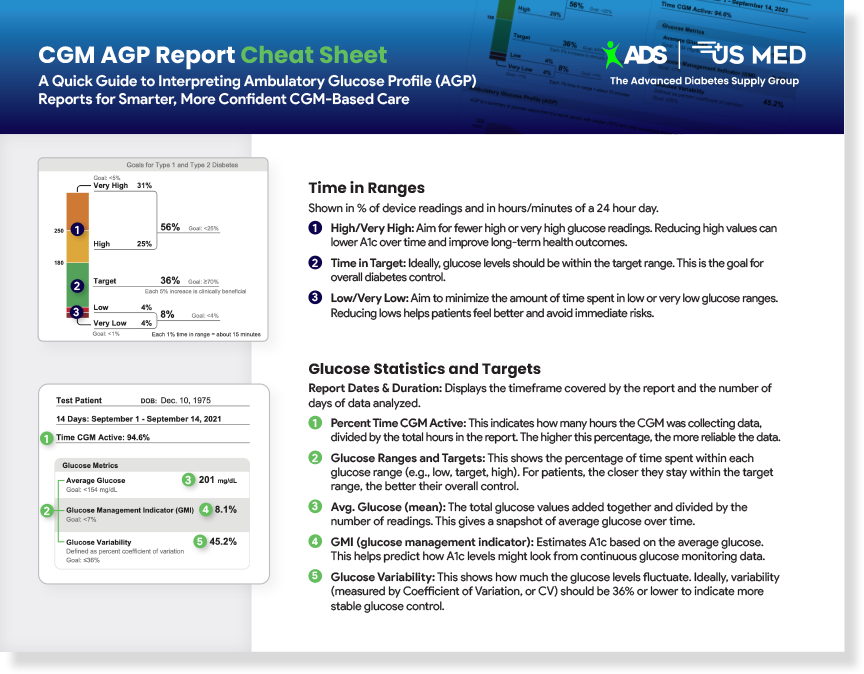
Time in Ranges
Shown in % of device readings and in hours/minutes of a 24 hour day.
- High/Very High: Aim for fewer high or very high glucose readings. Reducing high values can lower A1c over time and improve long-term health outcomes.
- Time in Target: Ideally, glucose levels should be within the target range. This is the goal for overall diabetes control.
- Low/Very Low: Aim to minimize the amount of time spent in low or very low glucose ranges. Reducing lows helps patients feel better and avoid immediate risks.
Click to enlarge.
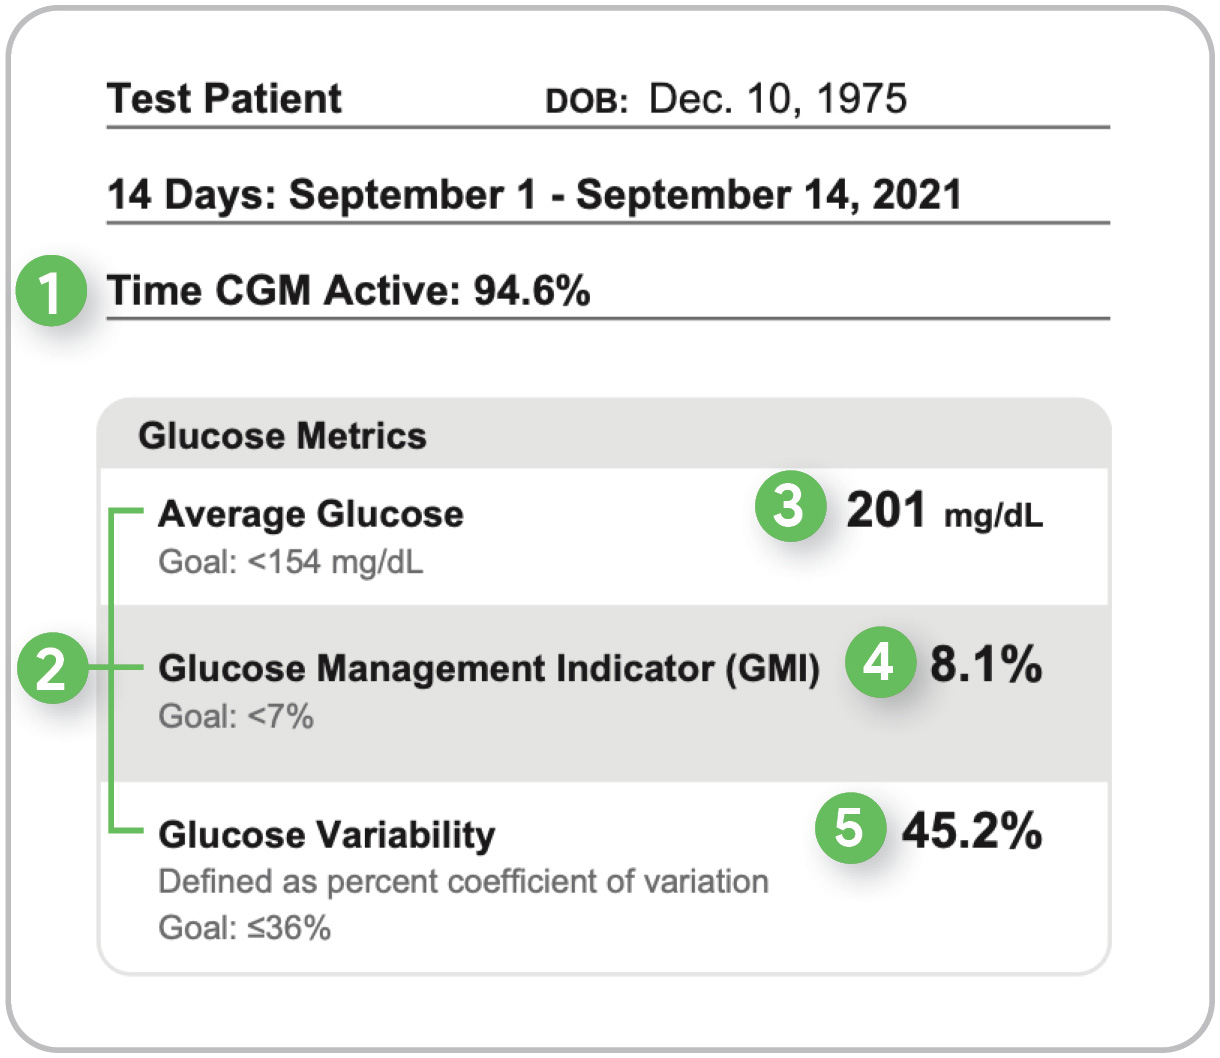
Glucose Statistics and Targets
Report Dates & Duration: Displays the timeframe covered by the report and the number of days of data analyzed.
- Percent Time CGM Active: This indicates how many hours the CGM was collecting data, divided by the total hours in the report. The higher this percentage, the more reliable the data.
- Glucose Ranges and Targets: This shows the percentage of time spent within each glucose range (e.g., low, target, high). For patients, the closer they stay within the target range, the better their overall control.
- Avg. Glucose (mean): The total glucose values added together and divided by the number of readings. This gives a snapshot of average glucose over time.
- GMI (glucose management indicator): Estimates A1c based on the average glucose. This helps predict how A1c levels might look from continuous glucose monitoring data.
- Glucose Variability: This shows how much the glucose levels fluctuate. Ideally, variability (measured by Coefficient of Variation, or CV) should be 36% or lower to indicate more stable glucose control.
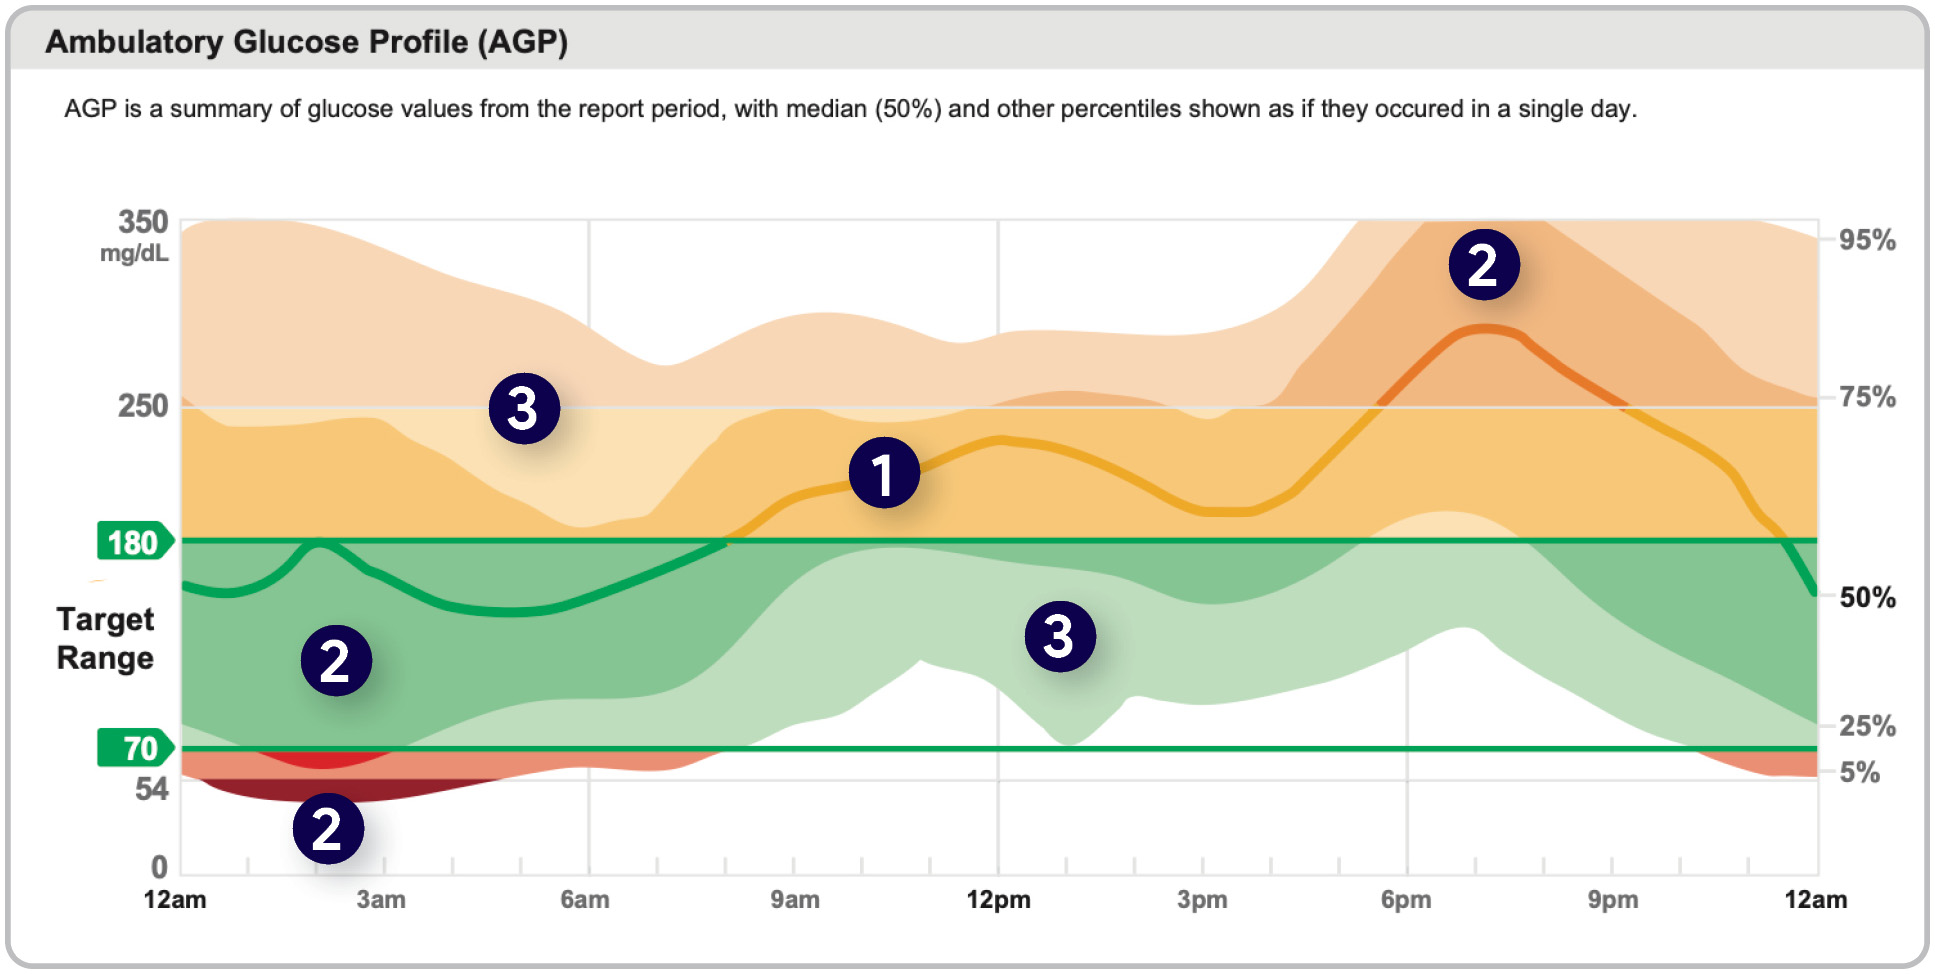
Glucose Profile
The daily glucose profile combines data from each day to give a single
24-hour picture of glucose patterns.
Click to enlarge.
- Heavy line: The median glucose level (where half of the readings are above and half are below). Ideally, this line should stay mostly flat and within the target range (70–180 mg/dL).
- Darker shading: This represents 50% of the glucose values. A narrow space between the shaded areas indicates better control and fewer fluctuations.
- Lighter shading: Represents the extremes, where 5% of readings are above (95th percentile) and 5% are below (5th percentile). The closer these lines are to the darker shaded area, the better the control.
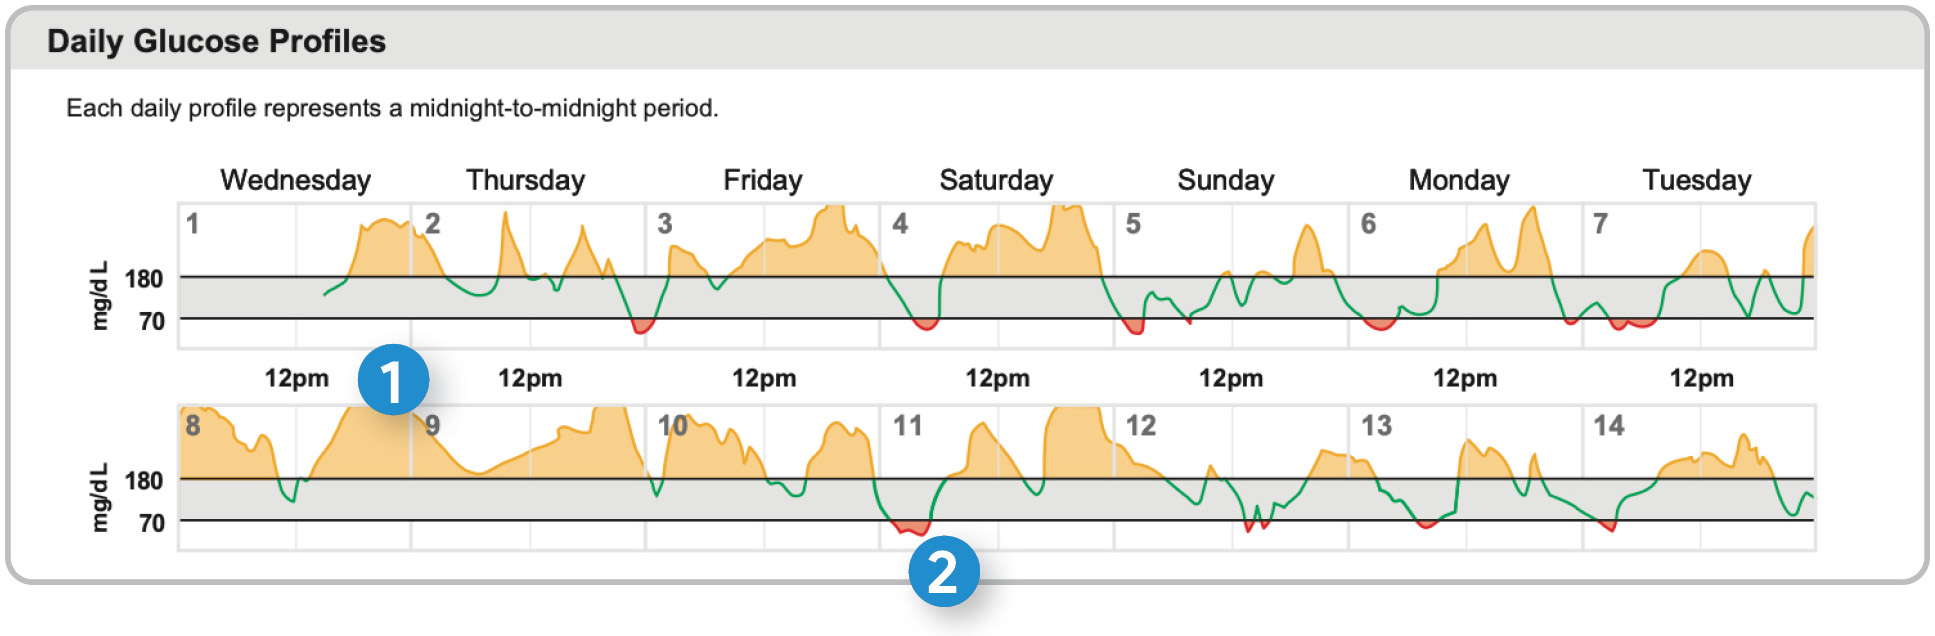
Daily Glucose Profiles
Each box represents a single day’s glucose pattern.
Click to enlarge.
If readings are:
- Above the shaded area: This indicates high glucose levels. Persistent high glucose can make it harder for patients to heal and increases the risk of long-term complications.
- Below the shaded area: Low glucose readings can cause symptoms like shakiness, weakness, or confusion, and pose immediate risks. Reducing these lows improves patient comfort and safety.
Source: International Diabetes Center. (n.d.). AGP reports. International Diabetes Center. Retrieved April 27, 2025, from http://www.agpreport.org/agp/
Need a copy of this article?
Better Service, Better Care.™ Better Solutions.
ADS offers superior diabetes supply solutions with no out-of-pocket costs for most Medicare Part B and D patients. Our members see 23% higher adherence to CGM therapy vs. pharmacy.* With 20+ years of experience and 83% nationwide insurance coverage, ADS provides streamlined ePrescribing with less paperwork. Our Member Success Team delivers personalized support, and NABP, ACHC, and URAC accredit ADS for trusted service.